Kalamus
Member
This is a tutorial for setting up your ServUO project in Visual Studio for debugging. This is not a tutorial on how to debug with Visual Studio as there are plenty of resources on the web for this. I will show a couple basics however for this tutorial. I'm using Visual Studio 2010 but the process should be the same for other version.
First open your ServUO project up in Visual Studio by double clicking your 'ServUO.sln' file. Once the project is loaded click Build Menu and select Build Solution to ensure you have the binaries needed for the following steps.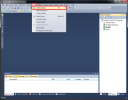
After the build process is finished, open the Solution Explorer window in Visual Studio if you don't already have it open. View menu -> Solution Explorer.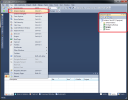
Inside your Solution Explorer right click your Scripts project and select Properties.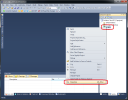
Go to the Debug tab on the left and select 'Start external program:' and click the '...' button to the right of that.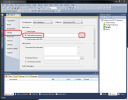
On the Select File dialog select ServUO.exe from your project folder and click Open.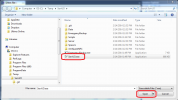
You should see the path appear next to 'Start external program:' Now place '-debug' into the 'Command line arguments:' section.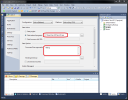
Now you can save your changes by using the Save button on the toolbar or by using File menu -> Save All. ServUO is now setup for debugging through Visual Studio.
Now I will show you some basics by debugging the StaffOrb.cs. Find and open StaffOrb.cs in the Solution Explorer by double clicking it (Scripts/Items/- Staff Items/). Now find the OnDoubleClick method and place the text editor caret on the first 'if' statement inside that method. Open the Debug menu and select 'Toggle Breakpoint' (this can also be done by clicking the far left of the line in the text editor where the breakpoint icon appears).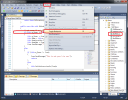
You should see a red circle on the far left showing that you have a Breakpoint like this.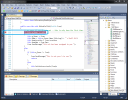
Now right click your Scripts project in the Solution Explorer. Select the 'Debug' menu and 'Start new instance'.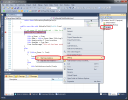
Visual Studio will now rebuild your project and after that is done you should see ServUO server launch. Now log into your server through UO and give yourself a StaffOrb if you don't already have one and double click it. UO should now freeze not letting you play any more and Visual Studio should be stopped on the breakpoint you set.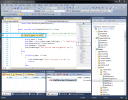
You can now step through the code line by line by pressing the F11 key (default for C# environment) or using the debug icons on the toolbar or Debug Menu. You can hover over variables with your mouse and it will pop up a display to show what their current values are like I did with 'from.map' below.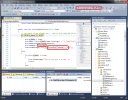
Step through the code and line for line and watch what's going on. This allows you to see why bits of code might not run, what the variables are and what you expect them to be, ect.
You can stop stepping line for line and let the server go back to running like normal until it hits another breakpoint by pressing the F5 key (default for C# environment) or using the debug icons on the toolbar or Debug Menu.
This pretty much concludes this tutorial and I would suggest reading up more on Visual Studio debugging on the web as there are tons more things that can be done besides the basics I showed.
First open your ServUO project up in Visual Studio by double clicking your 'ServUO.sln' file. Once the project is loaded click Build Menu and select Build Solution to ensure you have the binaries needed for the following steps.

After the build process is finished, open the Solution Explorer window in Visual Studio if you don't already have it open. View menu -> Solution Explorer.

Inside your Solution Explorer right click your Scripts project and select Properties.

Go to the Debug tab on the left and select 'Start external program:' and click the '...' button to the right of that.

On the Select File dialog select ServUO.exe from your project folder and click Open.

You should see the path appear next to 'Start external program:' Now place '-debug' into the 'Command line arguments:' section.

Now you can save your changes by using the Save button on the toolbar or by using File menu -> Save All. ServUO is now setup for debugging through Visual Studio.
Now I will show you some basics by debugging the StaffOrb.cs. Find and open StaffOrb.cs in the Solution Explorer by double clicking it (Scripts/Items/- Staff Items/). Now find the OnDoubleClick method and place the text editor caret on the first 'if' statement inside that method. Open the Debug menu and select 'Toggle Breakpoint' (this can also be done by clicking the far left of the line in the text editor where the breakpoint icon appears).

You should see a red circle on the far left showing that you have a Breakpoint like this.

Now right click your Scripts project in the Solution Explorer. Select the 'Debug' menu and 'Start new instance'.

Visual Studio will now rebuild your project and after that is done you should see ServUO server launch. Now log into your server through UO and give yourself a StaffOrb if you don't already have one and double click it. UO should now freeze not letting you play any more and Visual Studio should be stopped on the breakpoint you set.

You can now step through the code line by line by pressing the F11 key (default for C# environment) or using the debug icons on the toolbar or Debug Menu. You can hover over variables with your mouse and it will pop up a display to show what their current values are like I did with 'from.map' below.

Step through the code and line for line and watch what's going on. This allows you to see why bits of code might not run, what the variables are and what you expect them to be, ect.
You can stop stepping line for line and let the server go back to running like normal until it hits another breakpoint by pressing the F5 key (default for C# environment) or using the debug icons on the toolbar or Debug Menu.
This pretty much concludes this tutorial and I would suggest reading up more on Visual Studio debugging on the web as there are tons more things that can be done besides the basics I showed.
Last edited:

