You are using an out of date browser. It may not display this or other websites correctly.
You should upgrade or use an alternative browser.
You should upgrade or use an alternative browser.
- Thread starter Praxiiz
- Start date
Are you looking for Ultima Live? http://servuo.com/threads/ultima-live-map-streamer-and-editor.1997/#post-12981
I've decided to put some more work into this project. I've abandoned the old code base in favor of a completely 3D approach.
Since experimenting with the Sphere Slicing, it occurred to me that a better way to approach this problem is to calculate the Delaunay and Voronoi graphs on the surface of a sphere. This would allow better tectonic plate simulation to generate continents and mountains.
After full planet generation is complete, the sphere can be projected onto a rectangular map and rendered using UO tiles.
Stage One 3D: Generate Random Points on the surface of a sphere
Zoomed In:

Zoomed Out:

Stage Two 3D: Delaunay Triangulation of points on a sphere
Zoomed In:
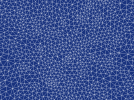
Zoomed Out:
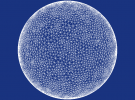
Stage Three 3D: Parsing Delaunay Triangle Graph into Voronoi Graph
Voronoi Polygon Graph is the dual graph of the Delaunay Triangle Graph
Zoomed In:
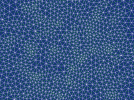
Zoomed Out:
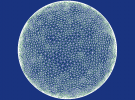
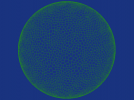
Stage Four 3D: Voronoi Polygons Only
This is using an averaging function to make the points more regular.
Zoomed In:

Zoomed Out:
Since experimenting with the Sphere Slicing, it occurred to me that a better way to approach this problem is to calculate the Delaunay and Voronoi graphs on the surface of a sphere. This would allow better tectonic plate simulation to generate continents and mountains.
After full planet generation is complete, the sphere can be projected onto a rectangular map and rendered using UO tiles.
Stage One 3D: Generate Random Points on the surface of a sphere
Zoomed In:

Zoomed Out:

Stage Two 3D: Delaunay Triangulation of points on a sphere
Zoomed In:

Zoomed Out:

Stage Three 3D: Parsing Delaunay Triangle Graph into Voronoi Graph
Voronoi Polygon Graph is the dual graph of the Delaunay Triangle Graph
Zoomed In:

Zoomed Out:

Stage Four 3D: Voronoi Polygons Only
This is using an averaging function to make the points more regular.
Zoomed In:

Zoomed Out:

Last edited:
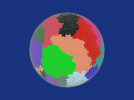
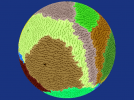
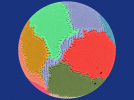
Most of the interesting activity occurs at plate boundaries. For this reason, I need to keep track of the polygons at plate boundaries.
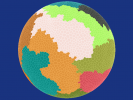
In this screenshot, each tectonic plate has lighter polygons at the edges. Each red polygon represents the seed polygon for the plate.
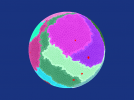
Some of the plates are very long and stretch around where I wouldn't expect them. The dark green plate in the image above is a good example. I'm still trying to decide how (and if its necessary) to modify the flood fill algorithm so this doesn't happen.
In this screenshot, each tectonic plate has lighter polygons at the edges. Each red polygon represents the seed polygon for the plate.

Some of the plates are very long and stretch around where I wouldn't expect them. The dark green plate in the image above is a good example. I'm still trying to decide how (and if its necessary) to modify the flood fill algorithm so this doesn't happen.
You can use photoshop to record actions. And make a map generator that way. Have a friend who created something to that effect using photoshop and map colors used in a map creator. It basically created random shapes and preserved tile transitions along the edge of the map. Because, in map creation you can't have 1x1 pixels. As the tile transition formulas couldn't transition. Also it would mess up coast lines ect... If you didn't have proper transitions. I know this probably doesn't help very much. And is vague. But, I have seen it done. He put a lot of work into automatic map generation. Believe, he plans on releasing it all one day.
I've seen tutorials on how to make random maps in photoshop, and they look really interesting. If I remember right they use random noise to build up shapes etc, and then do other procedures on them.
Instead of modeling the physics of the tectonic plates directly, as easier approach will be to build math functions that model the result of plate boundaries. That will allow calculation of vertex altitude based on distance from the plate boundaries.
Divergent Boundaries
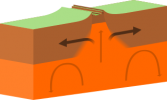
Author: domdomegg
License: Creative Commons Attribution 4.0 International
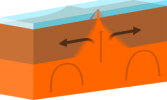
Author: domdomegg
License: Creative Commons Attribution 4.0 International
Instead of modeling the physics of the tectonic plates directly, as easier approach will be to build math functions that model the result of plate boundaries. That will allow calculation of vertex altitude based on distance from the plate boundaries.
Divergent Boundaries

Author: domdomegg
License: Creative Commons Attribution 4.0 International

Author: domdomegg
License: Creative Commons Attribution 4.0 International
Last edited:
Convergent Boundaries
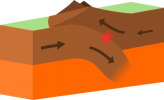
Author: domdomegg
License: Creative Commons Attribution 4.0 International
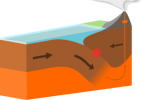
Author: domdomegg
License: Creative Commons Attribution 4.0 International
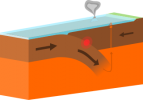
Author: domdomegg
License: Creative Commons Attribution 4.0 International

Author: domdomegg
License: Creative Commons Attribution 4.0 International

Author: domdomegg
License: Creative Commons Attribution 4.0 International

Author: domdomegg
License: Creative Commons Attribution 4.0 International
Last edited:
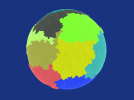
Unify boundary types by majority vote on each plate to plate border:
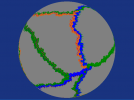
Green indicates that a plate is converging into a bordering plate
Blue indicates that a plate is diverging from a bordering plate
Orange indicates that a plate is neither converging nor diverging, it is a transform boundary
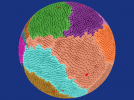
Each interior Tectonic Plate polygon is assigned to the closest plate border polygon:
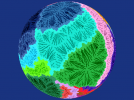

Last edited:
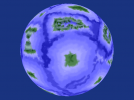
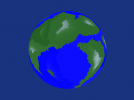
Now that boundary types have been identified, functions representing each boundary type can be applied based on distance from the boundary. Plate densities are also factored in to each altitude point.
Convergent Boundary Function
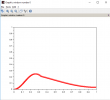
Convergent Boundary Results
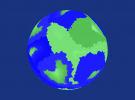
The lighter the green, the higher the altitude.
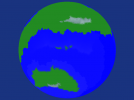
Convergent Boundary Function

Convergent Boundary Results

The lighter the green, the higher the altitude.


Last edited:

